Are riots more common or are just getting more publicity? In any case, from recent race riots in the US to past riots in France and elsewhere, they are certainly of great concern to everyone - probably even the people whose actions appear to have triggered the violence. Can math show when a demonstration might become a violent riot?
Diverse kinds of riots
Laurent Bonnasse-Gahot at the PSL Research University (Paris) and colleagues have released their mathematical model of how a violence “infection” spread through French society.
In looking at the 2005 Clichy-sous-Bois riots researchers noted the difference between them and the 2011 riots in England where the same group of rioters carried the violence with them, spreading their violence.
In Clichy-sous-Bois the rioters never left the area where they began and the research focused on just how did other riots spring up in other areas without any real connection with the initial rioters.
Analysis
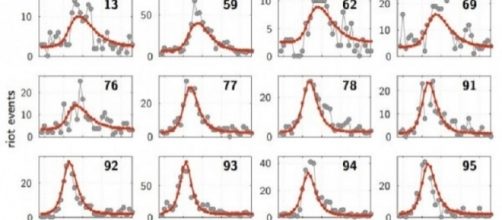
The researchers began with a massive database of all the daily crime reports recorded at police stations in more than 800 municipalities across France.This provided a comprehensive time line of events during the riots. “We thus get a data set composed of the number of riot-like events for each municipality, every day from October 26 to December 8, 2005, a period of 44 days, which covers the three weeks of riots and extends over two weeks after,” said Bonnasse-Gahot and co.
This data set reveals some curious similarities between the riots in each location.
For a start, the rioting seems to spike at a specific time, and then activity returns to the same background levels of violence that existed before. These spikes take the same shape even though they have a variety of amplitudes. And the same shape appears at all locations.
When the incidence of police violence reports from 800 French municipalities where charted over the period from before a riot to afterwards a strange thing happened - every riot produced a similar graph curve showing the move from background crime to a peak of violence, followed by a subsequent return to average. (Reporter's Note - the graphs all look like a sharply peaked "bell curve" normal distribution.)
The curves closely resemble the course of a disease infecting a localized population.
Early there is a pool of susceptible people. A certain number of them are “infected” by some event (reports of deaths, other riots, or, in the US by police shooting an unarmed black man in the back).
The riot spreads to like minded individuals at the peak, who then begin to disperse due to emotional or physical exhaustion, and by arrests. This leads to a reduction in violence.
What makes this look even more like an infection is that those who rioted don’t usually start another riot after they rest up - indicating they are immunised, just as they would be if they recovered from influenza.
Conclusions
The test of the results will come when it is applied to predict future riots. A striking feature of the analysis is that geographic closeness to a riot is a predictor of new riots.
Bonnasse-Gahot points out that the simplicity of the model, which used very few inputs, such as location, ethnic unrest, and police crime statistics, make it easy to apply to other situations. They acknowledge their model suggested a flare-up in the municipality of Fleury-Merogis, which didn’t show in the data but point out that a kindergarten was burned down and that wasn’t recorded as a riot event.
Role of social media
The fact that geographic proximity (it is more likely there will be new riots near other riots) is so important in the model shows that despite the common blame on ease of communications and social media as a trigger for unrest, it is less important that many think. But interpersonal ties between rioters is important (social pressure) as is similarity of circumstances - poverty, ethnic unrest, etc. The researchers pointed similar patterns of ethnic riots in the US and in 18th century UK food riots.

